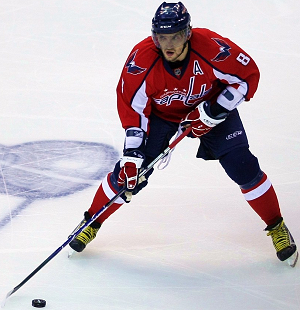
A Look into Alex Ovechkin’s Elite Power Play Abilities

"Alex Ovechkin2" by Keith Allison. Licensed under Public Domain via Commons.

Alex Ovechkin2” by Keith Allison. Licensed under Public Domain via Commons.

I don’t know if we’ll ever see a power play quite like that of this decade’s Washington Capitals. We can’t attach a firm date to it because it could extend as far as the end of Alex Ovechkin’s career at this rate, but we know that its peak of power began with the hiring of Adam Oates as Caps head coach back in 2012. Oates had run a successful 1-3-1 power play for the New Jersey Devils with Ilya Kovalchuk as his trigger-man, but nothing even close to the heights he managed to achieve with the man advantage in his two seasons in DC. Barry Trotz, to his credit, has kept the same formation — what’s that old adage about things that ain’t broke? — with only minor tweaks, and last year the power play continued to succeed.

Now there’s a lot to discuss about the formation and its success — I like to think of the Caps’ PP as a work of art more than anything else — but for the sake of this post I’m going to focus in on Alex Ovechkin. Never has there been a more criticized future first-ballot Hall of Famer, nor arguably a more controversial elite goal scorer. It should already be a given that Ovechkin is the best power play goal scorer of all time — he sits fifth overall in PPG/g despite playing in a significantly lower scoring era than his contemporaries like Mike Bossy and Mario Lemieux — but I would argue by the time he retires, he will also likely be the greatest goal scorer of all time period. It’s the man advantage recently, in the latter stages of Ovechkin’s goal scoring peak, that has been the sniper’s bread and butter. Since Oates brought the 1-3-1 to town, Ovi has scored 48% of his goals on the power play, compared to 33% prior to that. He scored 25 power play goals last year, six ahead of the next highest total in Joe Pavelski’s 19. You have to go back another five to reach the player who is in third — Claude Giroux with 14 — indicating how great of a season the Sharks’ center/winger had, but that’s a story for another day.

Continue reading

Hockey Abstract 2015 and the Skills Needed For Analysis

I was thinking today about the skills that it takes to be able to analyze hockey properly, and it took me back to classroom learning. As somebody who hated memorization, it was always a relief to me when a teacher explained that we didn’t need to know something specific for the test. Providing a periodic table, or a t-table, or allowing us to write our own “cheat sheets” for a test was interpreted as a measure of sympathy by the professor. “I know this stuff is hard as hell; I’ll cut you a break and relieve you of a little studying.”

The truth, though, is that allowing the use of these materials, or going as far as holding open-book tests, has practical legs. In the real world, whether in science or math – really in most fields – it is more important to be able to find and interpret information than to know it offhand. If one needs to perform a chi-squared test, for example, in the internet age I can find that information very easily. The more experience one has in the field, the less one will need to rely on guides to perform such calculations, but until that point there is no need to hold information that can easily be found.

Continue reading

Exceeding Pythagorean Expectation: Part 5

“Bryz-warmup” by Arnold C. Licensed under Public Domain via Commons.

Bryz-warmup” by Arnold C. Licensed under Public Domain via Commons.

This is the fifth part of a five part series. Check out Part 1, Part 2, Part 3, Part 4 here. You can view the series both at Hockey-Graphs.com and APHockey.net.

To quickly recap what I’ve covered in the first four parts of this series, I have updated the work that’s been done on Pythagorean Expectations in hockey, and am looking to find out whether teams that have the best lead-protecting players are able to outperform those expectations consistently.

The first step is to figure out how to assess a player’s ability to protect leads. To do this, for every season, I isolated every player’s Corsi Against/60, Scoring Chances Against/60, Expected Goals Against/60 (courtesy of War-On-Ice) and Goals Against/60 when up a goal at even strength. I then found a team’s lead protecting ability for the year in question by weighting those statistics for each player by the amount of ice time they winded up playing that year. For players that didn’t meet a certain threshold, I gave them what I felt was a decent approximation of replacement level ability. For example, here was the expected lead protecting performance of the 2014-2015 Anaheim Ducks in each of those categories.

Continue reading

Exceeding Pythagorean Expectations: Part 4

“Zdeno Chara 2012” by Sarah Connors. Licenced under Public Domain via Commons.

Zdeno Chara 2012” by Sarah Connors. Licensed under Public Domain via Commons.

This is the fourth part of a five part series. Check out Part 1, Part 2, Part 3, Part 5 here. You can view the series both at Hockey-Graphs.com and APHockey.net.

So now, four parts into this five part series, is probably a good time to discuss my original hypothesis and why I started this study. As I mentioned in my previous post, baseball has already gone through its Microscope Phase of analytics, where every broadly accepted early claim was put to the test to see whether it held up to strict scrutiny, and whether there were ways of adding nuance and complexity to each theory for more practical purpose. One of the first discoveries of this period was that outperforming one’s Pythagorean expectation for teams could be a sustainable talent — to an extent. Some would still argue that the impact is minimal, but it’s difficult to argue that it’s not there. What is this sustainable talent? Bullpens. Teams that have the best relievers, particularly closers, are more likely to win close games than those that don’t. One guess that I’ve heard put the impact somewhere around 1 win per season above expectations for teams with elite closers. That’s still not a lot, but it’s significant. My question would be, does such a thing exist in hockey?

Of course, there are no “closers,” strictly speaking. But there are players who close out games more often than others, and there are players whom coaches trust in late game lead-protecting situations more than others. Does a team with players who thrive in such situations have a higher chance of exceeding their expectation?

Continue reading

Exceeding Pythagorean Expectations: Part 3

“Pythagorus Algebraic Separated” by John Blackburne. Licenced under Public Domain via Commons. The 2006 Red Wings may have been the best hockey team since the lost season.

Pythagorus Algebraic Separated” by John Blackburne. Licensed under Public Domain via Commons.

This is the third part of a five part series. Check out Part 1, Part 2, Part 4, Part 5 here. You can view the series both at Hockey-Graphs.com and APHockey.net.  

Since the last post was getting a little long, I decided to hold off on releasing the full Pythagorean results. Linked you will find a table of every team since the lost season, sorted by the difference between its adjusted point total and its Pythagorean expectation. Essentially, the teams that have the highest numbers in the right-most column are likely to have been the most fortunate, and those at the bottom were possibly unlucky. If you look at the 2014-2015 results below, you will see which teams should be a little bit worried about their chances, and those which may be ready for a rebound. Tomorrow, I will address what the point of this whole study was, and we’ll look at some more data.

Continue reading

What Was Wrong With The 2014-2015 Boston Bruins?

Johnny Boychuk 2013-06-07” by Michael Miller. Licensed under Public Domain via Commons.

Joe Haggerty posted a revealing piece last week about what went wrong with the Boston Bruins last season. According to Brad Marchand on the record, as well as a variety of sources off it, the B’s were a divided team, with only part of the group truly on board with the team’s march to the playoffs. Others, he claims, without naming names, didn’t seem particularly bothered to miss out.

It’s a very interesting case, and unfortunately it’s impossible to think of it in terms of an actual case study, since there’s nothing scientific about the way in which players may discuss their perception of the causality involved in failure, and certainly everything a front office says with regards to move it makes has to be taken with a grain of salt. That said, the eye-rolling that some in the analytics community may take part in with regards to this story is a mistake. Dressing room chemistry is important. Leadership is important. And this story does contain some important lessons. Let’s take a closer look.

“In the past years, we were family, but for some reason this past year we were definitely a little bit divided, and had different cliques. It could’ve been because we had a lot of guys coming up in different times from Providence; they felt a lot more together, and it seemed like the older guys didn’t do a good job at integrating other guys.”

There’s no reason to distrust Marchand on this point. I completely believe that the team was divided, and it’s quite possible that guys coming and going from the AHL played a part. Every team deals with those comings and goings to different degrees, but a lack of leadership and communication could play a part in those guys not being well integrated. Just from personal experience, I can tell you that playing on a team when you feel well-liked, or a part of the group, is a lot easier – and often leads to a better performance – that when you feel ostracized or the unity just isn’t there.

Continue reading

Exceeding Pythagorean Expectations: Part 2

“Pythagorus Algebraic Separated” by John Blackburne. Licenced under Public Domain via Commons. The 2006 Red Wings may have been the best hockey team since the lost season.

Pythagorus Algebraic Separated” by John Blackburne. Licensed under Public Domain via Commons.

This is the second part of a five part series. Check out Part 1, Part 3, Part 4, Part 5 here. You can view the series both at Hockey-Graphs.com and APHockey.net.

In Part 1, I looked at some of the theory behind Pythagorean Expectations and their origin in baseball. You can find the original formula copied below.

WPct = W/(W+L) = Runs^2/(Runs^2 + Runs Against^2)

The idea behind the formula is that it is a skill to be able to score runs and to be able to prevent them. What isn’t a skill, however — according to the theory — is when one scores or allows those runs. Teams over the course of weeks or months may appear to be able to score runs when they’re most necessary, to squeak out one-run wins, but as much as it looks like a pattern, it is most often simple variance. If you don’t fully buy into that idea, or you don’t really understand what I mean by variance, read this and then come back. Everything should be a lot clearer.

When applying Pythagorean Expectations to hockey, there are a couple of factors that complicate the matter. First of all, the goal/run scoring environment is very different. Hockey is a much lower scoring sport. That means that a team is more likely to win, say, 10 one-goal games in a row than in baseball. The lower the total goals, the closer the average scores, the more variance involved. Second, not all games are worth the same number of points. In baseball, you either win or lose, so you use run differential to figure out a winning percentage. But winning percentage doesn’t really work as a statistic in hockey since you can lose in overtime and get essentially half a win, while your opponent gets a full win.

Continue reading

Exceeding Pythagorean Expectations: Part 1

Nashville Predators vs Detroit Red Wings, 18. April 2006” by Sean Russell. Licensed under Public Domain via Commons. The 2006 Red Wings may have been the best hockey team since the lost season.

This is the first part of a five part series.Check out Part 2, Part 3, Part 4, Part 5 here. You can view the series both at Hockey-Graphs.com and APHockey.net.

The 2015-2016 NHL season is almost here, and our sport has come upon a new phase — arguably the third — in its analytics progression. The first stage was about broad ideas and testing; I’ll call it the Discovery Phase. It involved public minds brainstorming large-scale ideas about the conventional truisms of the game, looking to prove and disprove that which many had taken for granted. It lent us ideas like the undervaluing of small players and terms like Corsi and PDO. It was revolutionary but not yet a revolution. The second phase was the Recognition Phase, which was kicked off by the Summer of Analytics. Teams began to buy into public work as worthy of investment and began to question their own practices. Now, as we saw it in baseball, a third phase is emerging. One in which much of the public is willing to accept the initially-controversial public ideas, but in which analysts are pushing back on generalities in situations that are often team and player dependent. We are now in a phase where analysts take a magnifying glass to every claim being made. For example, there is no more argument about whether or not Corsi is relevant or important — at least not among those in positions of influence. The question is in what cases it works best, and maybe more importantly, where and why it fails. Because it does, after all. There are players whose finishing abilities, defensive prowess, special teams impact and leadership mean that the value Corsi presents is significantly off base. And it’s important in a billion-dollar industry to figure out how to account for that. The same can be said for any of the metrics that came out of the Discovery Phase or that continue to be developed today.

The point of all this is that we’re at a point where you no longer dismiss the exceptions; you dig into them. There is a lot in the world that can be explained by simple variance, but the game of hockey is far too complicated to assign anything that doesn’t fit a successful model as such.

Continue reading