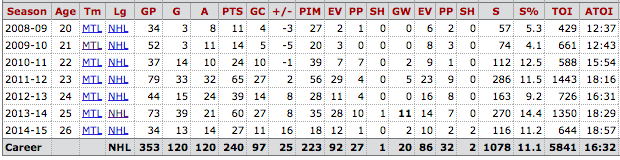
Micah Blake McCurdy (a good follow on Twitter here) has been posting division projections for most of the season, and today he explained how his model works in more detail. While his work doesn’t account for injuries, goaltending, special teams, or shot quality, I still think it’s one of the better projection models I’ve seen and is certainly useful. After all, he’s proven it works pretty well using past seasons. The most interesting passage from the article (read here) though for me was this:
You may not understand all of that, and that’s fine, so let me summarize what was interesting to me about it. The predictive power of this model increases when you base your projections on the statistics from more past games, but only to a certain point. Once you get past about 25 games (the number Micah decides to use), the predictive power begins to decrease. Now hockey analysts are always trying to get the largest sample size possible, but this is a good demonstration of one of the biggest conflicts in analytics for any sport (I’ll have a post on these at some point), one for which we as of yet don’t really have a solution. That conflict is this:
One needs a big sample size to make reliable conclusions regarding data, but bigger sample sizes leave one increasingly susceptible to changing environments which can cloud the data in its own right.
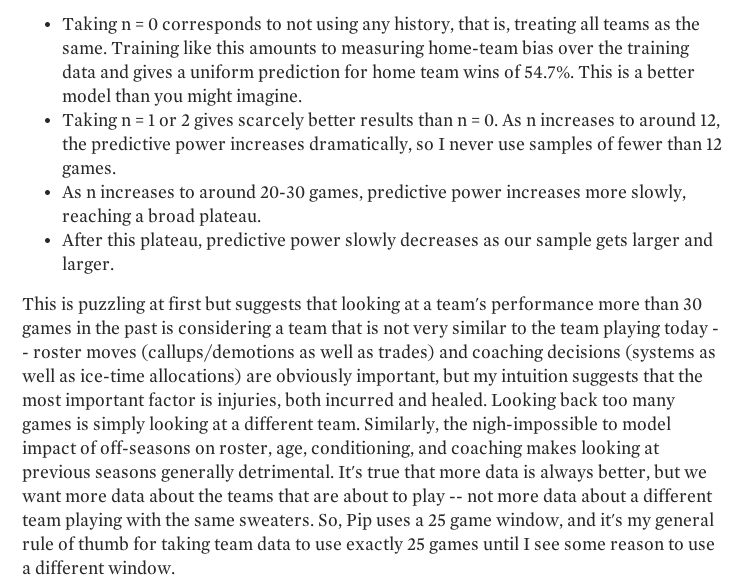
For example, we know that shot quality is prone to lots of randomness. How do we best determine a player’s true shooting talent. Let’s pretend it’s the summer of 2012 and we’re trying to determine just that for Max Pacioretty. Take a look at what we have to work with.
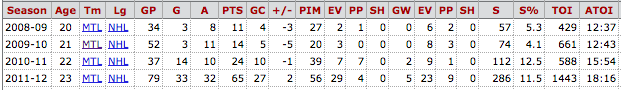
One couldn’t reliably say after one full season of significantly above average shooting percentage (’11-’12) that Pacioretty has significantly above-average shooting talent, so we want to include as much data as possible to filter out some of the noise. If we take his career shooting percentage at this point in time, it would come out to a nice 10.0%. Now take a look at Pacioretty’s career shooting numbers as of today.
In his following full season, Pacioretty shot 14.4%. His shooting percentage since that summer is 12.2%, which is pretty similar to the 11.8% that he put up just in the 2010-11 and 2011-12 seasons combined. His data from the first 86 games he played in the NHL in which he could barely score is virtually useless in predicting his true shooting talent. Now this is definitely an extreme example, but it shows how some players can have difficulty adapting to the NHL, or are subject to other factors that can have real impacts on results. Believe it or not, there is such thing as a player coming back from injury and being afraid of crashing the net like they once did. That could decrease a player’s shooting percentage.
So what does this all tell us? Well it tells us to be careful with data, something I preach in just about every one of my posts here. There’s nuance everywhere, far more in hockey than in stop-start sports like baseball (although this particular factor could exist there as well). It is important to recognize hockey as probabilistic, but also as a product of choice. A power forward could make the decision to never enter the crease again, and that would have a significant impact on shooting percentage that wouldn’t be subject to the regression a model would predict. It’s not something that would happen much, but it could once or twice, who knows what goes on inside a player’s head? Ultimately, we must remember that a high Corsi percentage doesn’t tell us a player is very good, it tells us that by and large a player with that Corsi is very good. This is a distinction that is critical, and one which separates in my mind smart hockey analysts from those who go too far in the other direction from purists.
